Every quarter, Fundera releases The State of Online Small Business Lending: a report that makes use of our data to educate business owners, borrowers, lenders, bankers, and anyone else interested in the trends of online small business lending.
We do this because transparency isn’t just a buzzword at Fundera—it’s our mission. From our Small Borrower Bill of Rights to our very own business model, we’re trying to bring openness and accessibility to the lending industry. The more you know, the fairer your loan terms can be, and the higher you can grow your business. When it comes to financing and funding, small business owners deserve to understand their options.
This report in particular takes a look at millennials—how they borrow, how they run their businesses, and how they stack up to non-millennials in everything from loan types they prefer to how well they know their credit scores. It also includes data on Fundera’s lender network, as well as trends we’ve noticed in eligibility and APR. Check out the PDF here and feel free to email us at transparency@fundera.com if there’s anything else you’d like to see in our next one.
Executive Summary
Takeaways:
- Millennials are more technology-forward in the ways they apply for online loans, relying more on mobile and organic search than non-millennials.
- As expected, millennials match with more short-term loan options than non-millennials through Fundera. Interestingly, they seem to prefer lines of credit and equipment loans, especially leaning more towards lenders with greater automation.
- Millennials accurately predict their credit scores more often than non-millennials, albeit by a small amount. This trend holds true even in the “Excellent” (700+) credit score bucket.
- By contrast, millennials tend to ask for larger loan amounts than they receive compared to non-millennials, perhaps indicating more optimism or naivety.
Data Findings:
- Fundera has helped to fund a greater dollar volume of medium-term loans and medium-term lines of credit this quarter compared to last (up 2% and 6%), and less of short-term loans and short-term lines of credit (down 3% and 1%).
- The Fundera network saw an increase in weighted APR this quarter by 1.9%, likely due to an increase in the APRs of short-term loans.
- Millennials applied to online loans through Fundera on mobile more than non-millennials by 8%.
- A greater proportion of millennial business owners had “Excellent” (700+) credit scores than non-millennials: 27% to 24%.
Q1 2016: Millennials & Small Business Lending
Few subjects have attracted as much attention in popular media as the millennial generation. What millennials think, how they act, and especially how they impact the economy are often matters for debate and discussion, and for good reason: millennials make up the largest generation in U.S. history and are currently entering their peak spending years. The effects of this generational shift in behavior have only just begun.
Given its unique position at the center of alternative lending, alongside its dedication to championing transparency in the small business lending industry, Fundera is dedicating this quarterly report to analyzing millennials as small business borrowers. Identifying the demographics, motivations, and habits of the millennial generation will help educate the alternative lending industry on how to adapt as it moves forward.
For the purposes of this report, millennials are defined as those born between the years of 1982 and 2004, as determined by researchers Neil Howe and William Strauss. The report data covers almost all transactions mediated by Fundera between February 2014 and mid-March 2016 (Q1 2016) inclusive, and covers a wide variety of both customer demographics and small business loan types. (Note that customers without submitted dates of birth were excluded to maintain the integrity of the data.) This variety in both product offerings and customers gives Fundera an unusual amount of access to trends and shifts within online small business lending, the scope of which is outlined below.
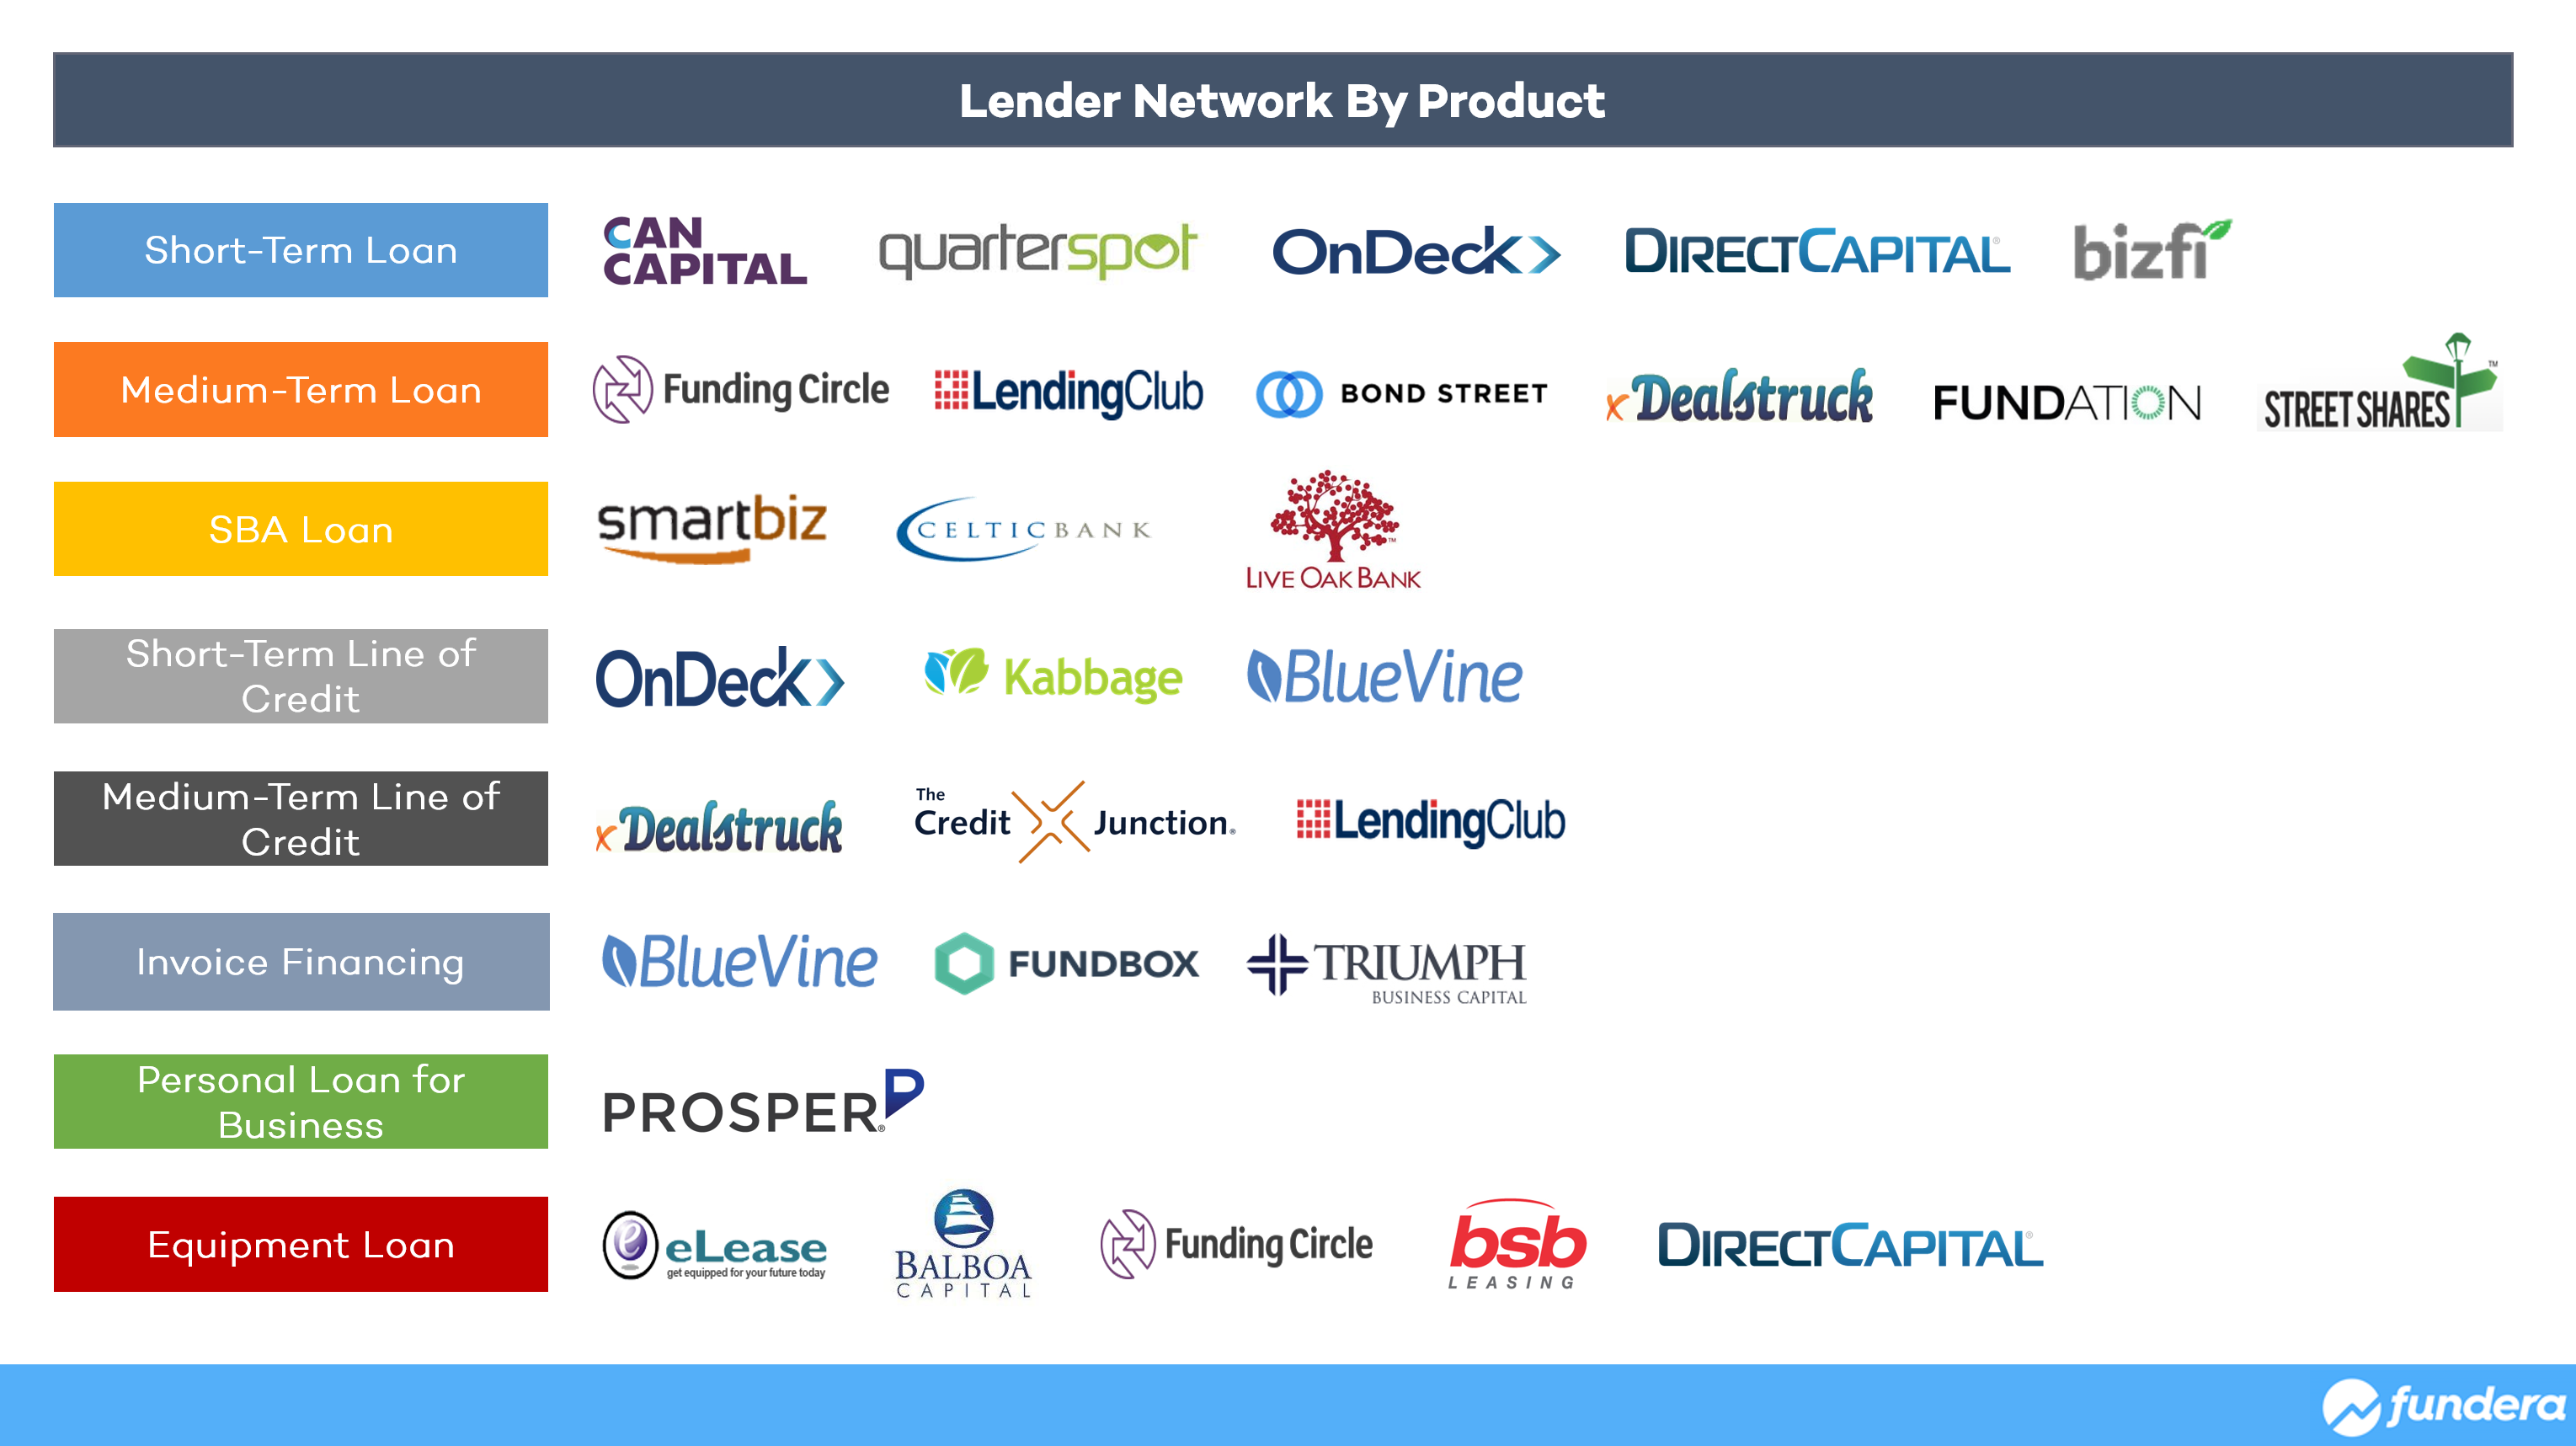
A. Comprehensive Lender Network
Fundera chooses its lender partners carefully, working only with fair, honest, and proven companies in the alternative lending industry. However, as the industry has continued to succeed, Fundera can offer a wider variety of loan products to small business owners across its growing roster.
The table below illustrates those lenders and their associated loan products. More details and customer reviews can be found on Fundera’s lender review site as well.
B. Diverse Small Business Owners
Fundera’s marketplace model, with multiple lenders and an extensive array of loan products, gives it access to a broad sweep of small business owners across the U.S.
The data in this report encompasses:
- Over 2,500 loans funded
- More than $140MM funded
- More than 22,000 small business owners, including nearly 17,000 non-millennials and slightly over 5,000 millennials
- Customers with credit scores from sub-550 to 700+
- Customers with annual revenue between <$50K and >$2M
- Customers from all 50 states
- Businesses from 0 to 35+ years of age
While this data does not reflect the entire online alternative lending industry, it does engage with a significant number and variety of borrowers looking to online alternative lending as a source of business financing. There are enough data points for millennial and non-millennial borrowers to make these trends meaningful. Fundera’s hope is that it can provide some actionable insights into how business owners and online lending interact.
1. Brief Overview of Fundera in Q1 2016
Before analyzing the habits of and differences between millennial and non-millennial borrowers, this report will offer an inside look at Fundera’s Q1 2016 loans funded, its eligibility standards across all products, and the evolution of its weighted average APR since Q4 2014.
A. Dollar Volume by Product Type
The following chart shows Fundera’s dollar volume by product type for Q1 2016.
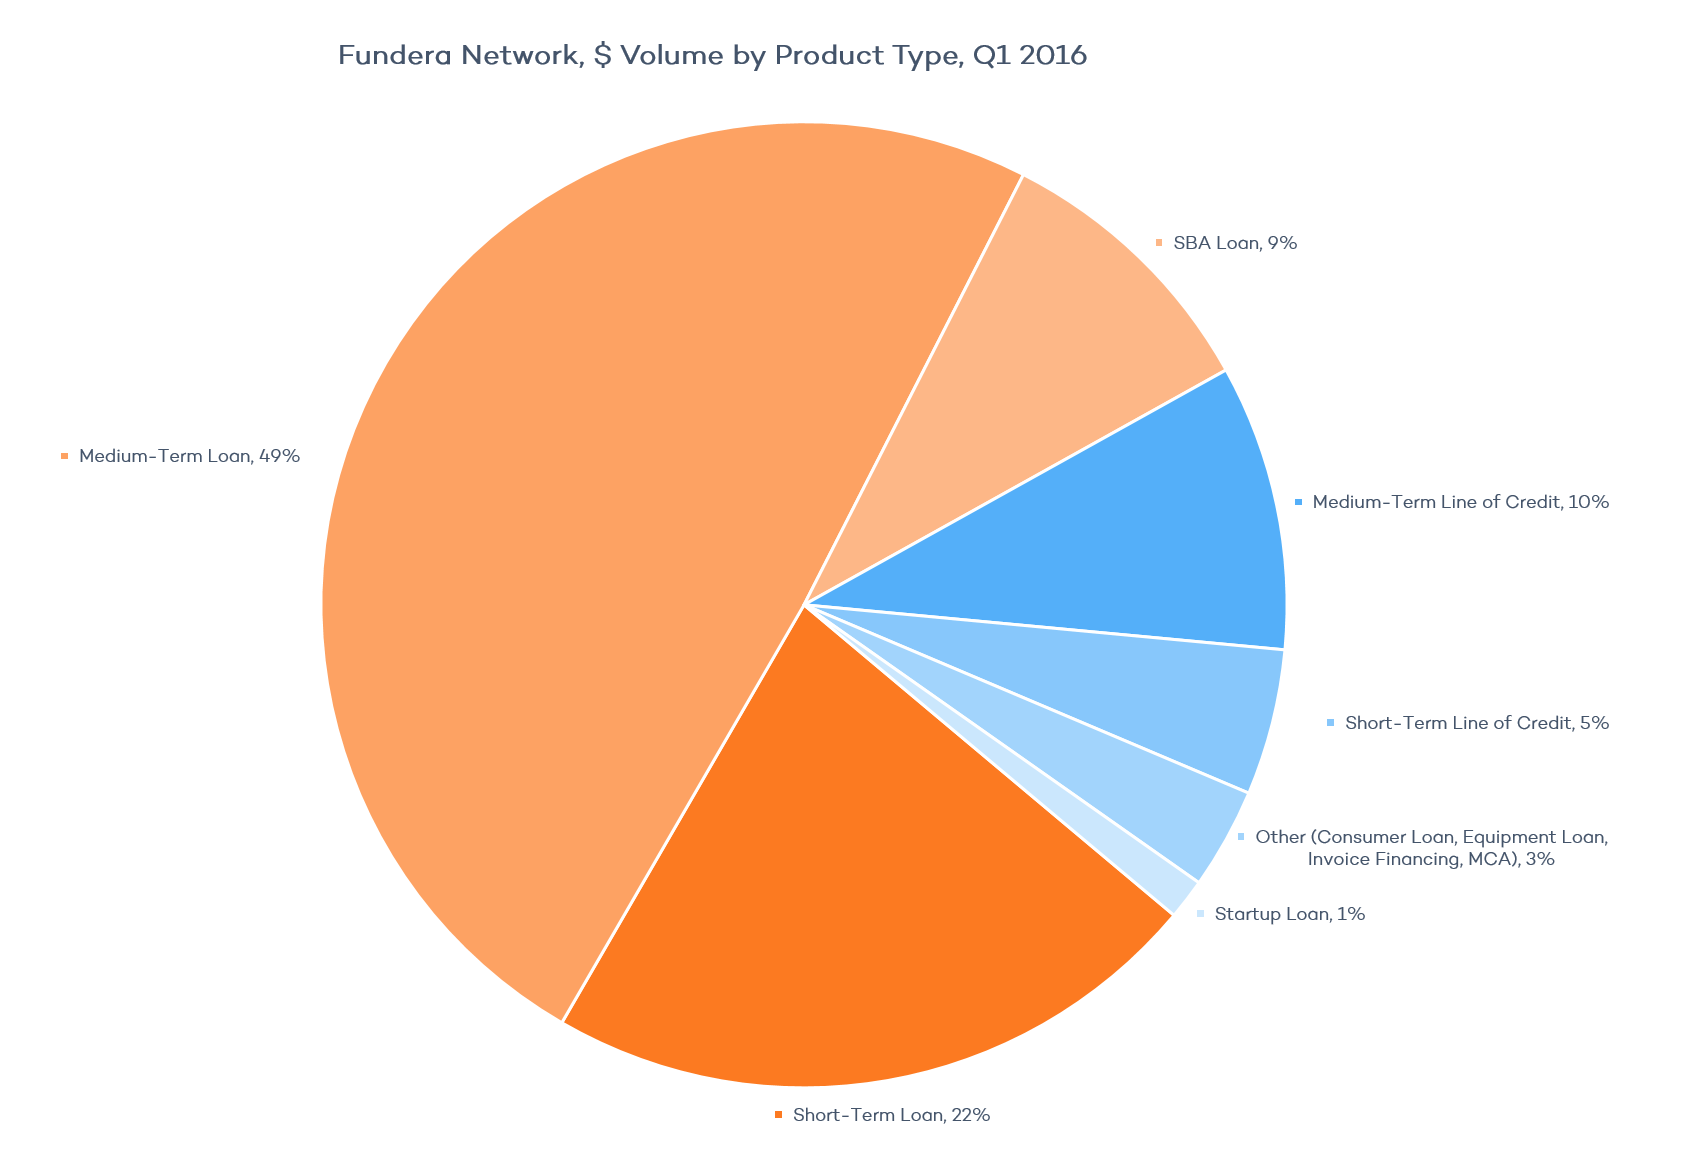
Compared to last quarter, medium-term loans have increased by 2%, while short-term loans have decreased by 3% and SBA loans by 2%.
On the other hand, the medium-term line of credit product has increased from 6% to 10%, and the short-term line of credit decreased by 1%.
Overall, this quarter has seen a continuation of the trend of Fundera helping to finance more medium-term products and fewer short-term products.
B. Eligibility & APR by Product
The chart below breaks down current eligibility and APR ranges by loan product on Fundera’s platform according to their interquartile ranges: the data between the 25th and 75th percentiles. This was done to remove end cases and highlight the average ranges that borrowers can expect.

Compared to Fundera’s last quarter, the short-term line of credit now has a higher minimum average APR, while the medium-term line of credit’s maximum average APR ends at 25 instead of 40. This is additional evidence that Fundera’s decision to segment the line of credit product into short-term and medium-term subproducts makes sense, as they cater to very different kinds of borrowers.
The short-term loan’s interquartile range for APR ends at 56 and the short-term line of credit’s ends at 67.5.
C. Weighted APR by Quarter
The following shows the general decrease in weighted APR throughout Fundera’s operation. (Before Q4 2014, Fundera did not help fund enough loans quarterly to create a consistent data set.)
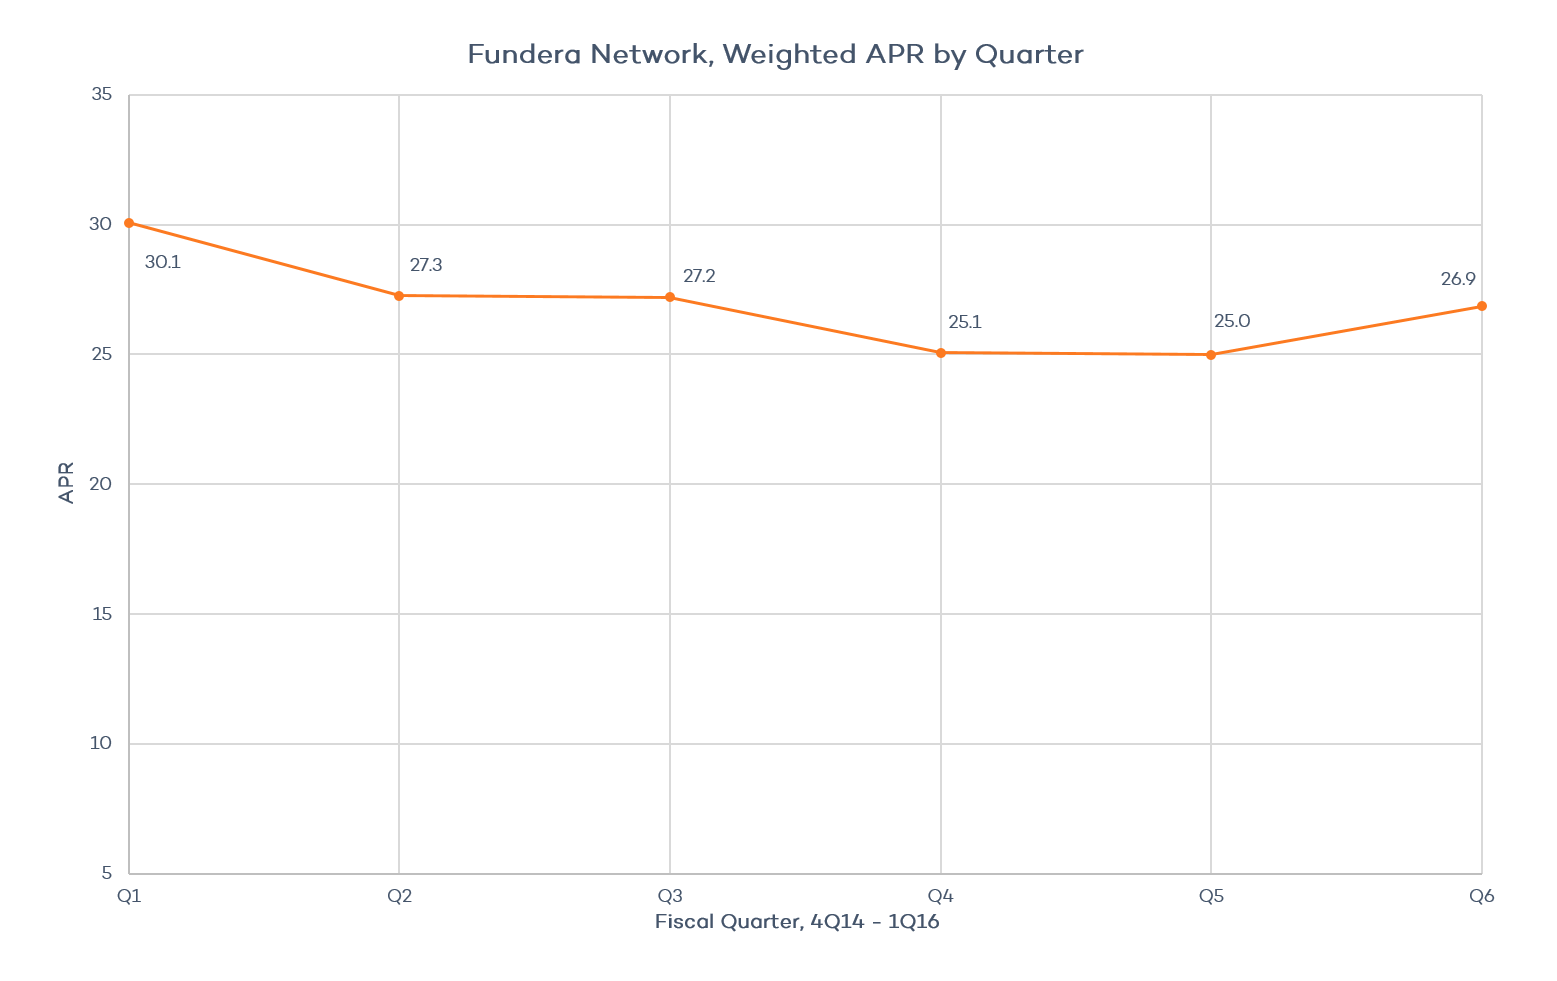
The uptick from Q4 2015 to Q1 2016 is due to an increase in the APRs for short-term loans on Fundera’s platform, canceling out the rise of medium-term loans and lines of credit by dollar volume.
2. How Millennials Apply for Online Loans
As a generation that has grown up with swift technological change as the norm, millennials unsurprisingly demonstrate more technology-forward habits than non-millennials. Their behaviors towards online loan applications follow this trend as well.
A. Loan Application Device
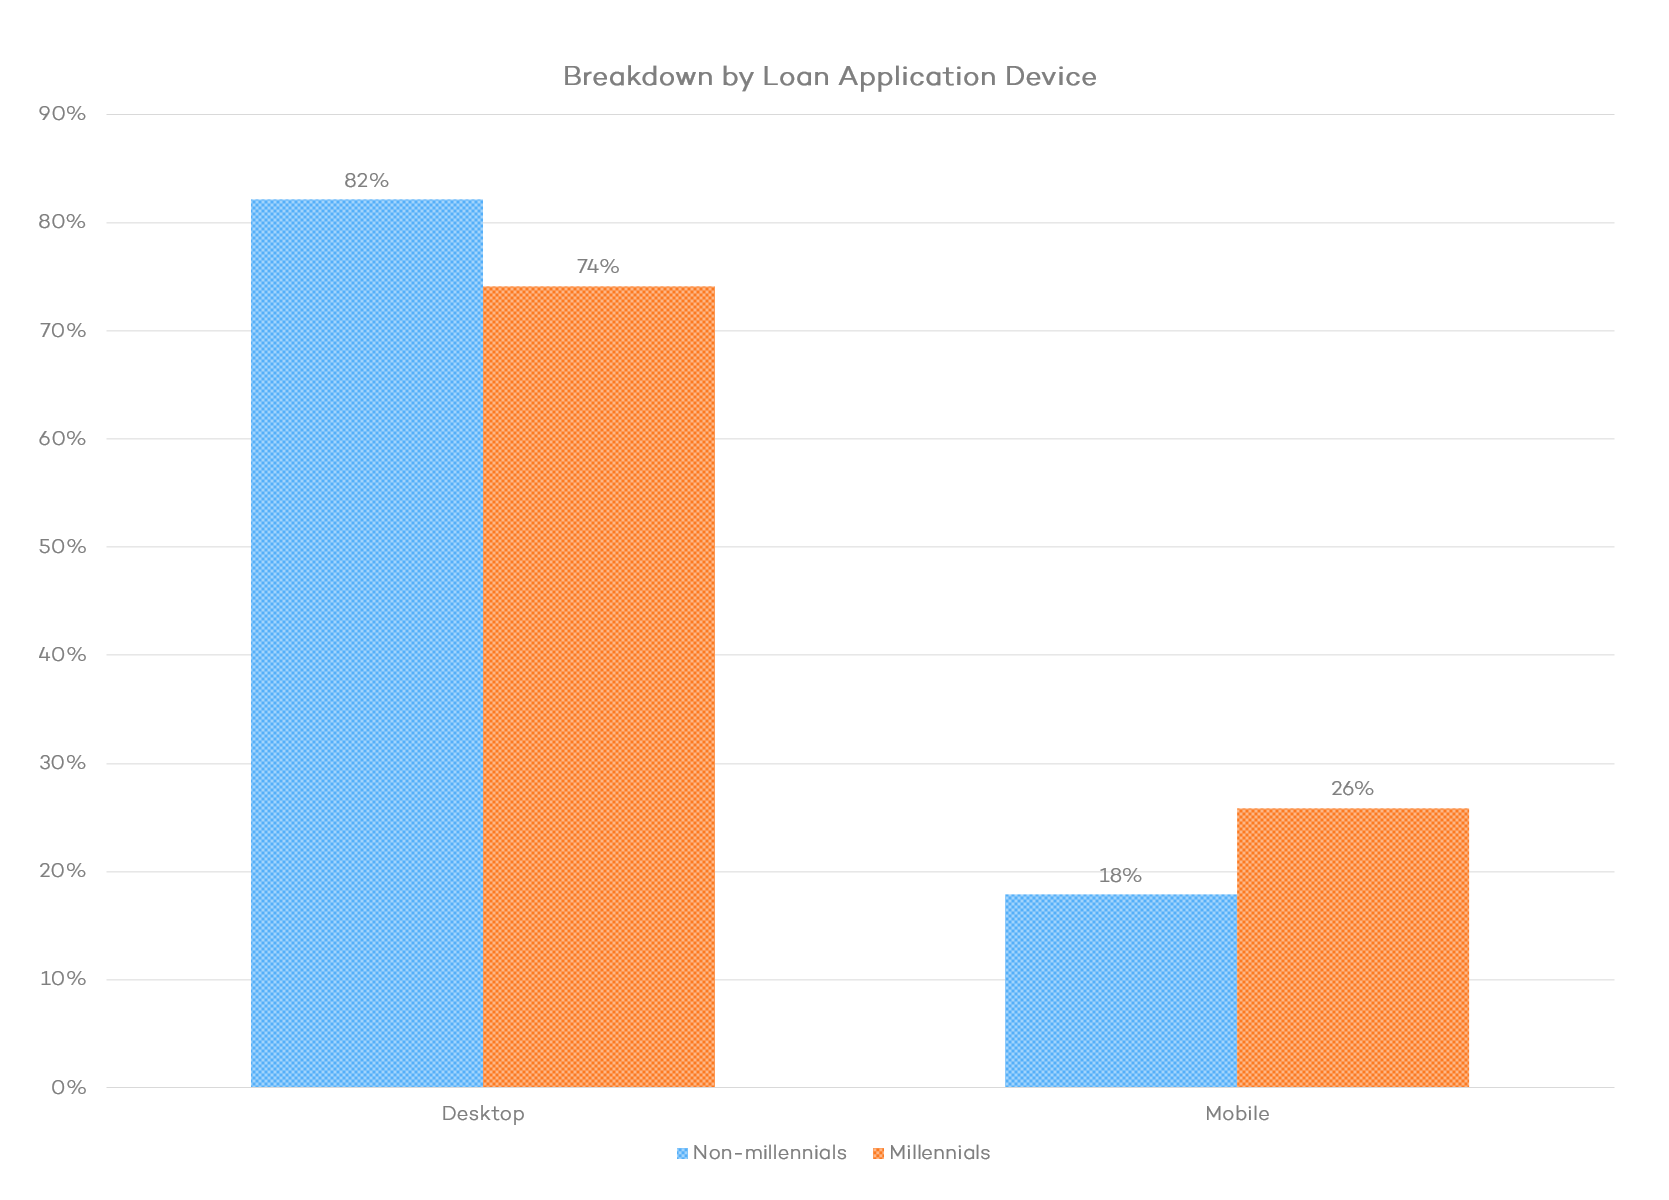
Almost a fifth of non-millennials applied for a business loan through Fundera’s mobile questionnaire, while over a quarter of millennials did so. Whether this is due to more mobile browsing, greater comfort with mobile experiences, higher trust in newer technology, or some combination thereof on the part of millennials cannot be determined by our data alone.
Regardless, millennials are on track to make up 75% of the global workforce by 2025, so lenders need to begin preparing for the changing habits of their customer base. As more small business borrowers apply for financing on mobile devices, lenders should embrace mobile-friendly websites, loan applications, and borrower portals, or risk losing business to more technology-forward competitors.
B. Customer Acquisition Channels

The above chart compares how millennials and non-millennials come through Fundera’s two most effective acquisition channels: Facebook advertisements and organic search traffic. The percentages refer to total acquisition, though only Facebook advertising and organic search traffic are shown here.
More of Fundera’s millennial customers find the service by actively searching keywords (with a 6.6% difference from non-millennials), while non-millennial customers respond more to targeted advertisements browsing Facebook (by 15.1%): a relatively passive, opportunity-grabbing rather than opportunity-seeking action.
One factor likely contributing to this difference is the aging of Facebook’s active user population: proportionally, millennial and teenage categories have decreased while older user groups have grown. It remains the most popular social network, but if millennials continue moving towards other platforms, those involved with the online lending industry should adjust their advertising strategies to compensate for this generational split.
Additionally, millennials’ greater reliance on organic search demonstrates their habits of thorough online research. They read user reviews, research products and services before purchase, and look into a brand’s social presence more often than non-millennials do: 50% versus 21% for user reviews and product research and 53% versus 37% for social media research.
Online and alternative lending companies should therefore take care to offer useful, accessible information that millennials want to see, as well as cultivating supportive testimonials and curating a social media presence. While millennials may not rely on social media platforms like Facebook as much as non-millennials, they are still considered important indicators of a company’s value and integrity.
3. Millennials as Borrowers
This section will compare millennials to non-millennials as small business borrowers. Many of these insights will not surprise if it is kept in mind that millennials are, by definition, younger than their counterparts, and thus have not had as much time to build credit, revenue, or time in business.
As Fundera’s Q3 2015 quarterly report showed, personal credit score and annual revenue are the primary drivers of a borrower’s loan product eligibility. It is therefore to be expected that millennials match with shorter-term, higher-rate loans.
However, there are data points that provide an interesting perspective into how millennials run their businesses and what kinds of borrowers they make.
A. Personal Credit Score
More millennials fall into the “Challenged” (below 579) personal credit score range than non-millennials, but this is likely a byproduct of less time available to build credit. Millennials and non-millennials even out in the “Good” (621 – 659) range, but unexpectedly, millennials are over-index in the “Excellent” (700+) category.

It may be that millennials have been able to achieve higher credit scores because of increased awareness of their scores and the factors that determine them. Resources like Credit Karma give valuable insights into maintaining and raising personal credit, and as millennials research more online, they likely take advantage of these educational opportunities.
More will be said on millennials’ relationship to their personal credit scores in the next section of this report as well.
B. Annual Revenue
Similar proportions of millennial and non-millennial Fundera customers fell into the $100K – $250K annual revenue category, while non-millennials dominated categories with greater revenue and millennials fell more into the lower revenue buckets.
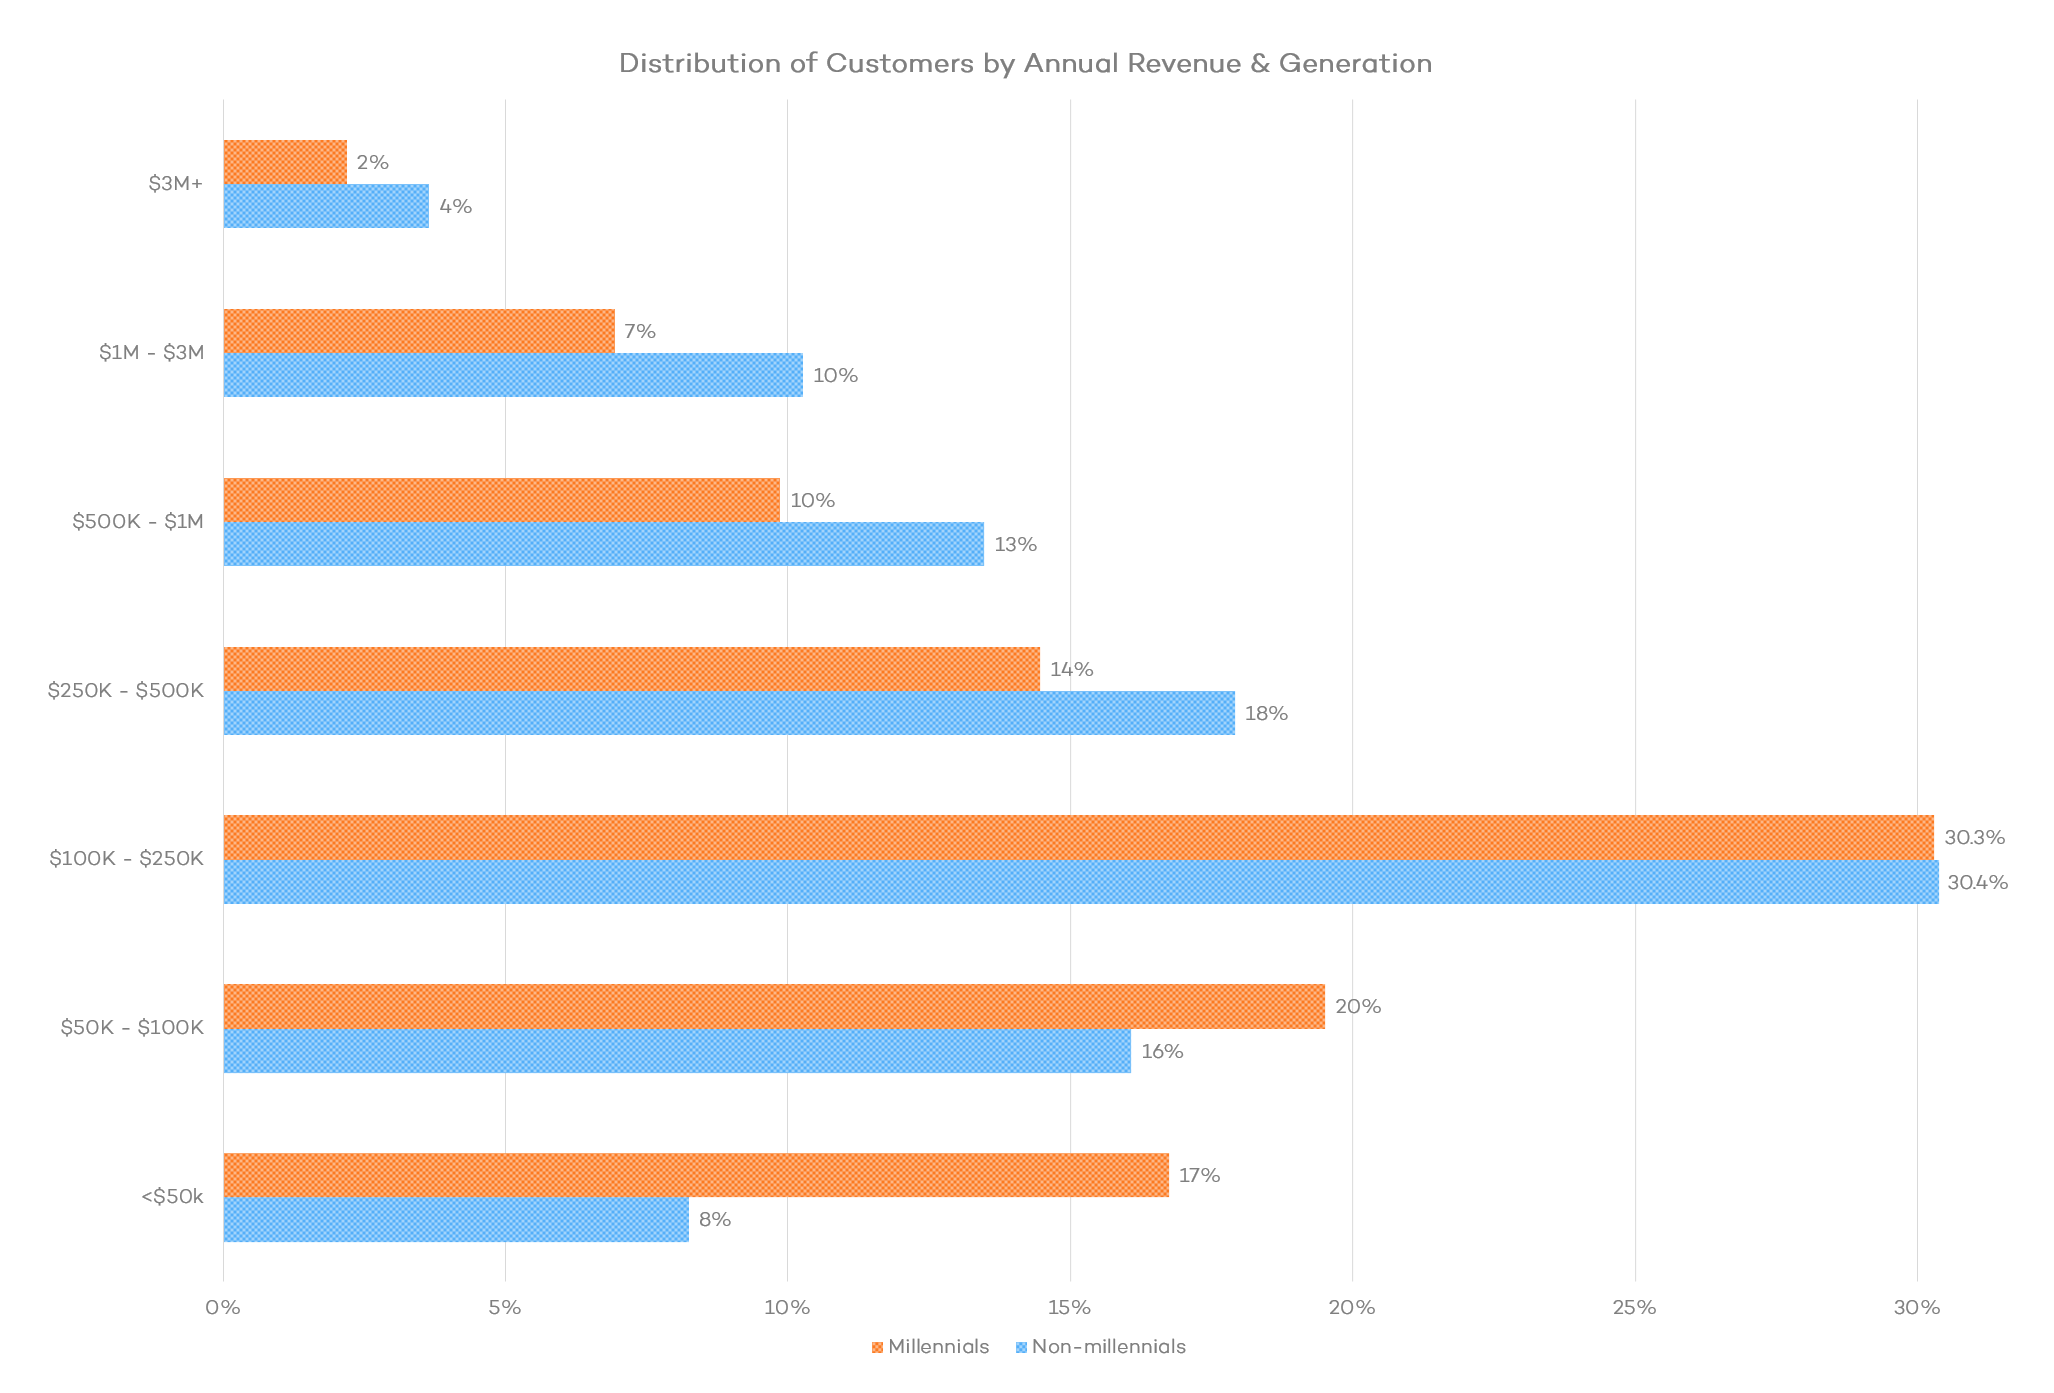
The <$50K category includes startup businesses as well, which contains a greater portion of millennial customers than it does non-millennial customers. Although it is unclear whether millennials are truly the fearless entrepreneurial generation that some believe it to be, lenders should consider preparing to serve the needs of more millennial-owned startup businesses that typically face difficulty in securing traditional loans. Otherwise, these companies may look into options other than debt financing to fund their growth.
C. Industry
The following 10 industries all belong in the top twenty most popular industries by Fundera customer, but those with smaller differences between millennials and non-millennials have been removed.

In line with their technology-forward application habits, millennials also gravitate towards businesses dealing with electronics, online services, ecommerce, and marketing, while falling short in independent medical practices and strategy/general consulting. Regarding the former category, far fewer millennials than non-millennials have completed their medical educations and established themselves enough to run a medical office.
D. Funded Loan Product
In accordance with the observations on trends in credit score, annual revenue, and time in business, it makes sense that more millennials tend towards shorter-term products and startup loans, while non-millennials capture more SBA loans, medium-term lines of credit, and consumer loans.
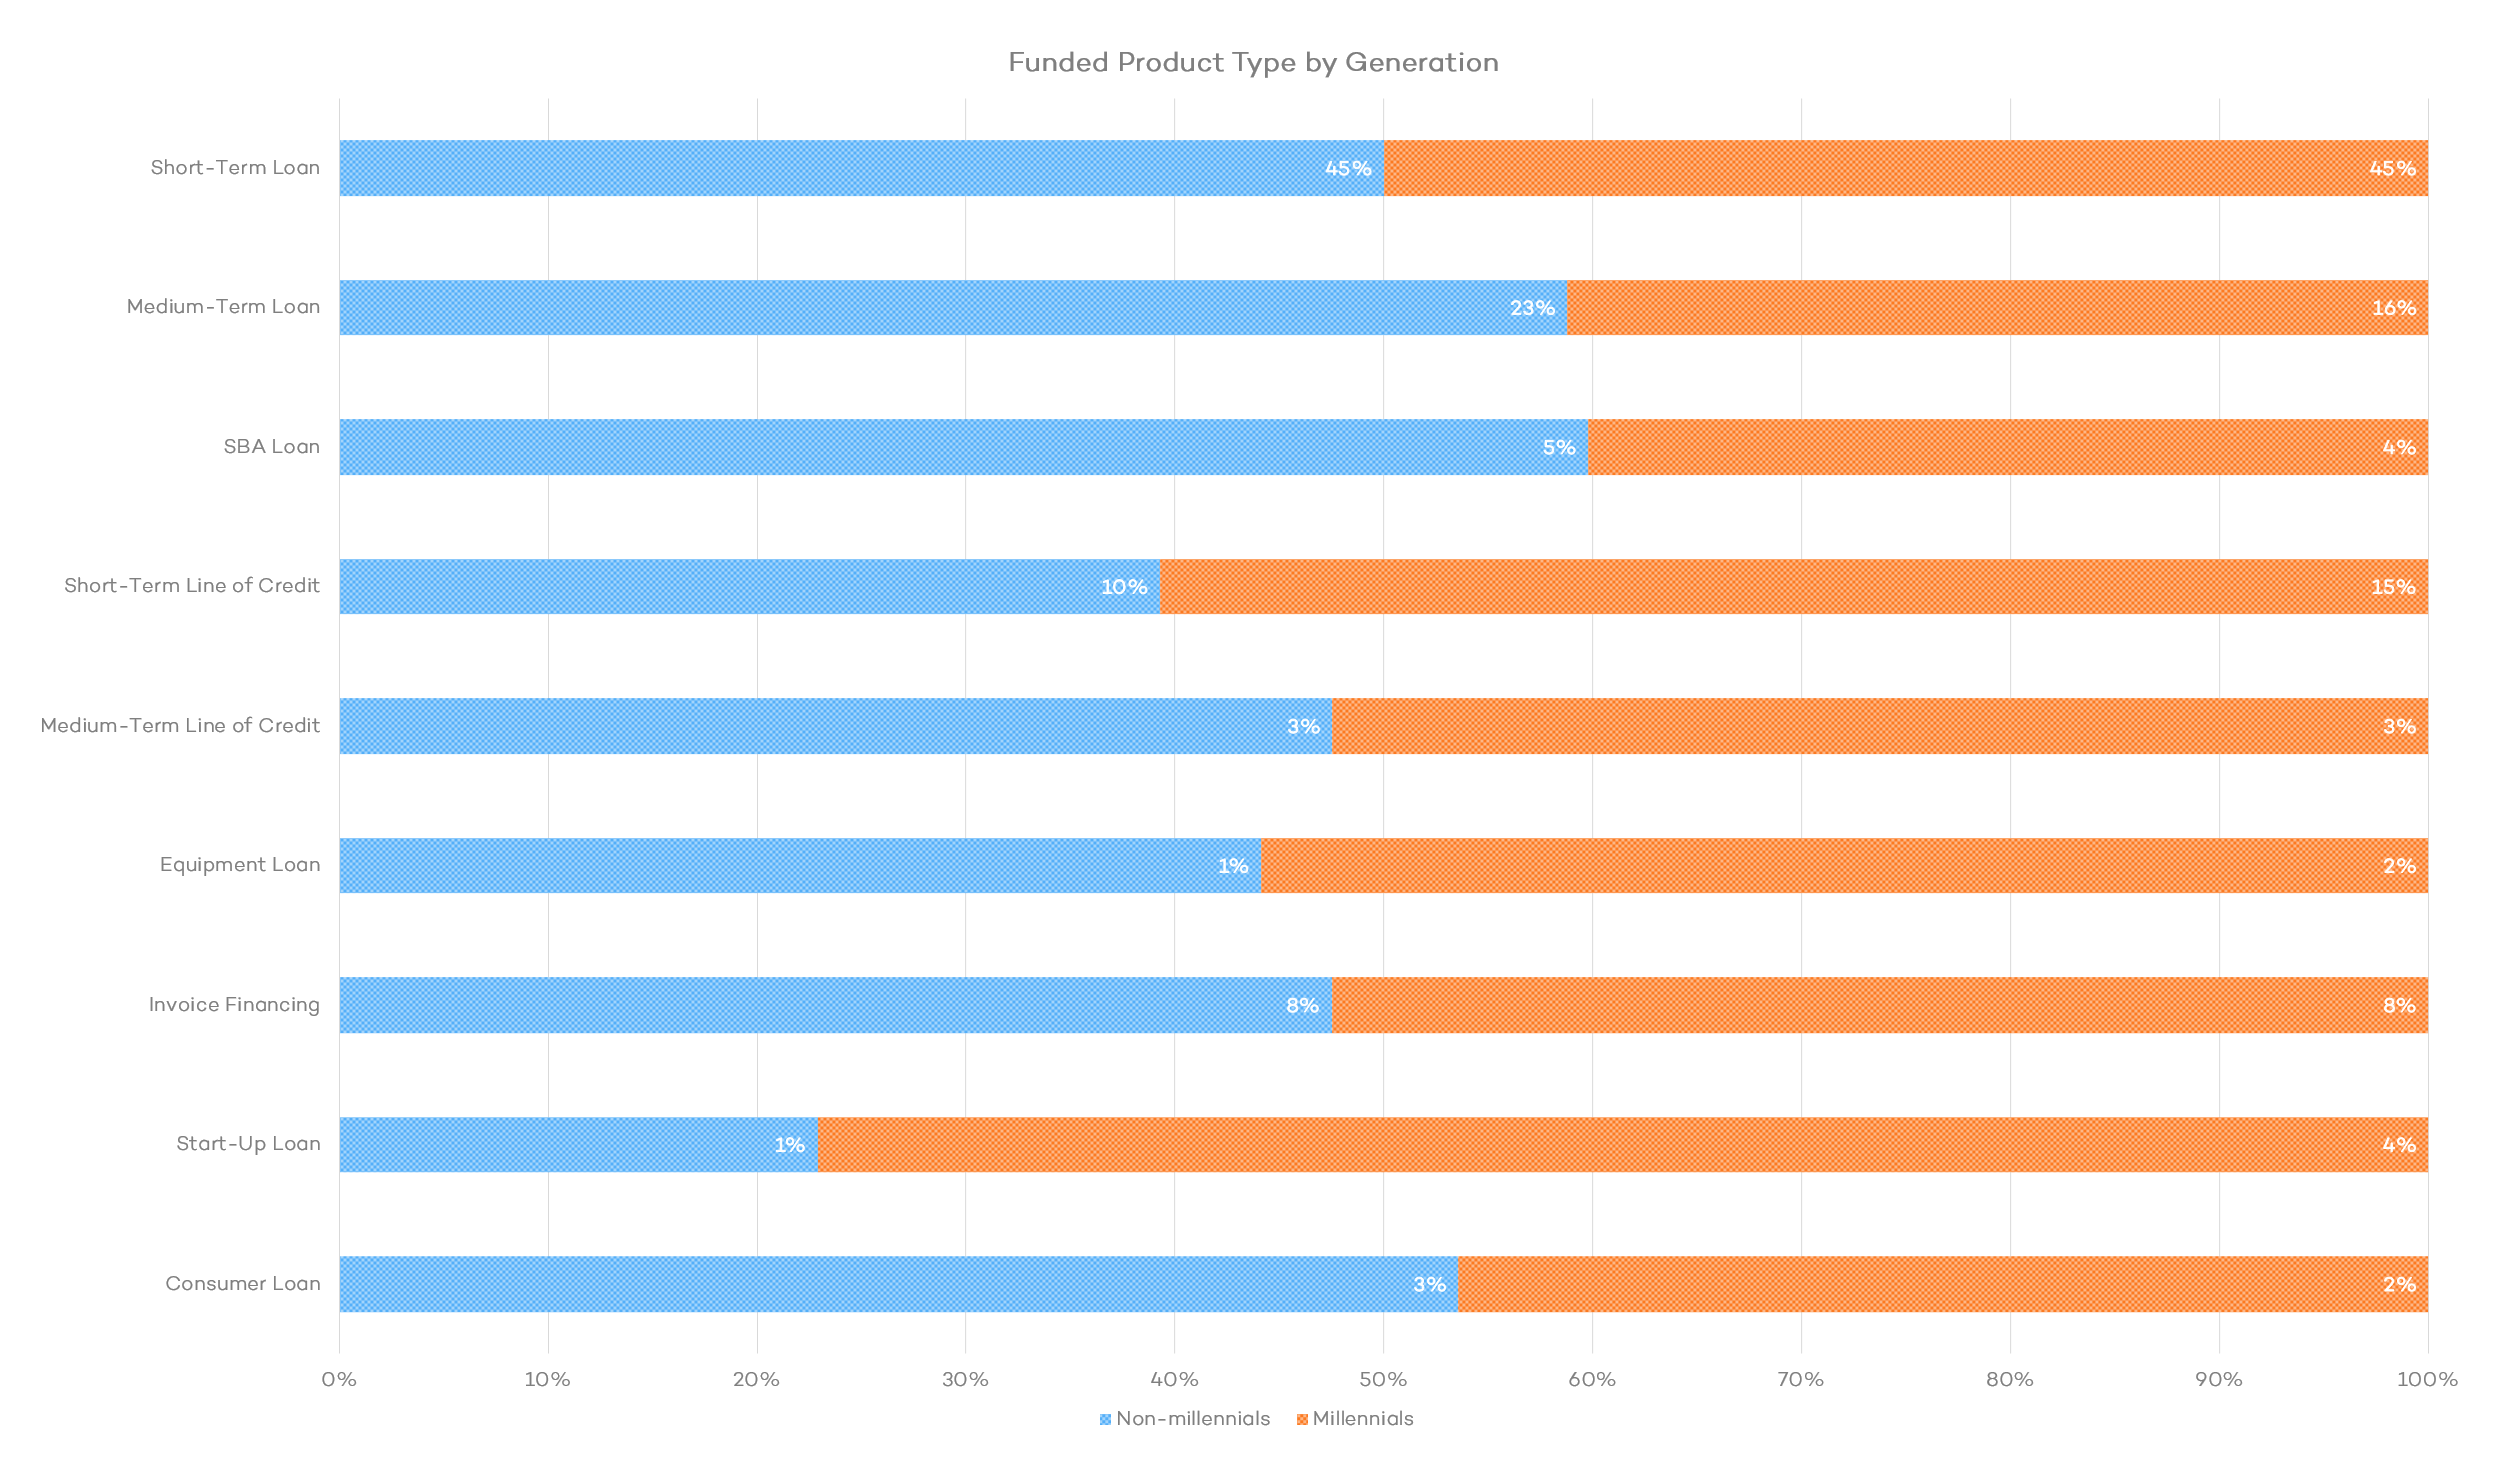
However, it may not be immediately apparent why millennials make up more of Fundera’s equipment loans and invoice financing. The likely reason is that these product types are asset-based, and thus rely more on the value of the collateralized equipment or invoices than on credit scores or business histories.
E. Use of Funds
All of the following loan purposes belong in Fundera’s top 5 with the exception of “Acquisition,” included here as it shows a larger difference between millennials and non-millennials.

In line with the previous section, a substantially greater portion of millennials searching for funding intend to acquire equipment.
Though this cannot be proven out by Fundera’s data alone, it seems probable that millennials, as a generation that came of age with a massive economic recession, exhibit more caution with their debt. Millennials come in below the national average with both average debt ($23,332) and average balance per credit card ($2,682), and are nearly twice as averse to owning a credit card as non-millennials (63% to 35%). As a result, it may make sense that millennial small business owners choose to take on debt to finance specific expenses, like equipment or acquisition, as opposed to general business investments.
The most likely explanation for the difference in “Debt Refinancing / Consolidation” is simply that millennials do not have borrowing histories of the same length that non-millennials do, and thus on average will have accrued less debt to refinance or consolidate.
Curiously, slightly more of the millennial pool of customers express intent to expand than of the non-millennial group.
F. Loan Size
There are few significant differences between millennials and non-millennials regarding loan size.
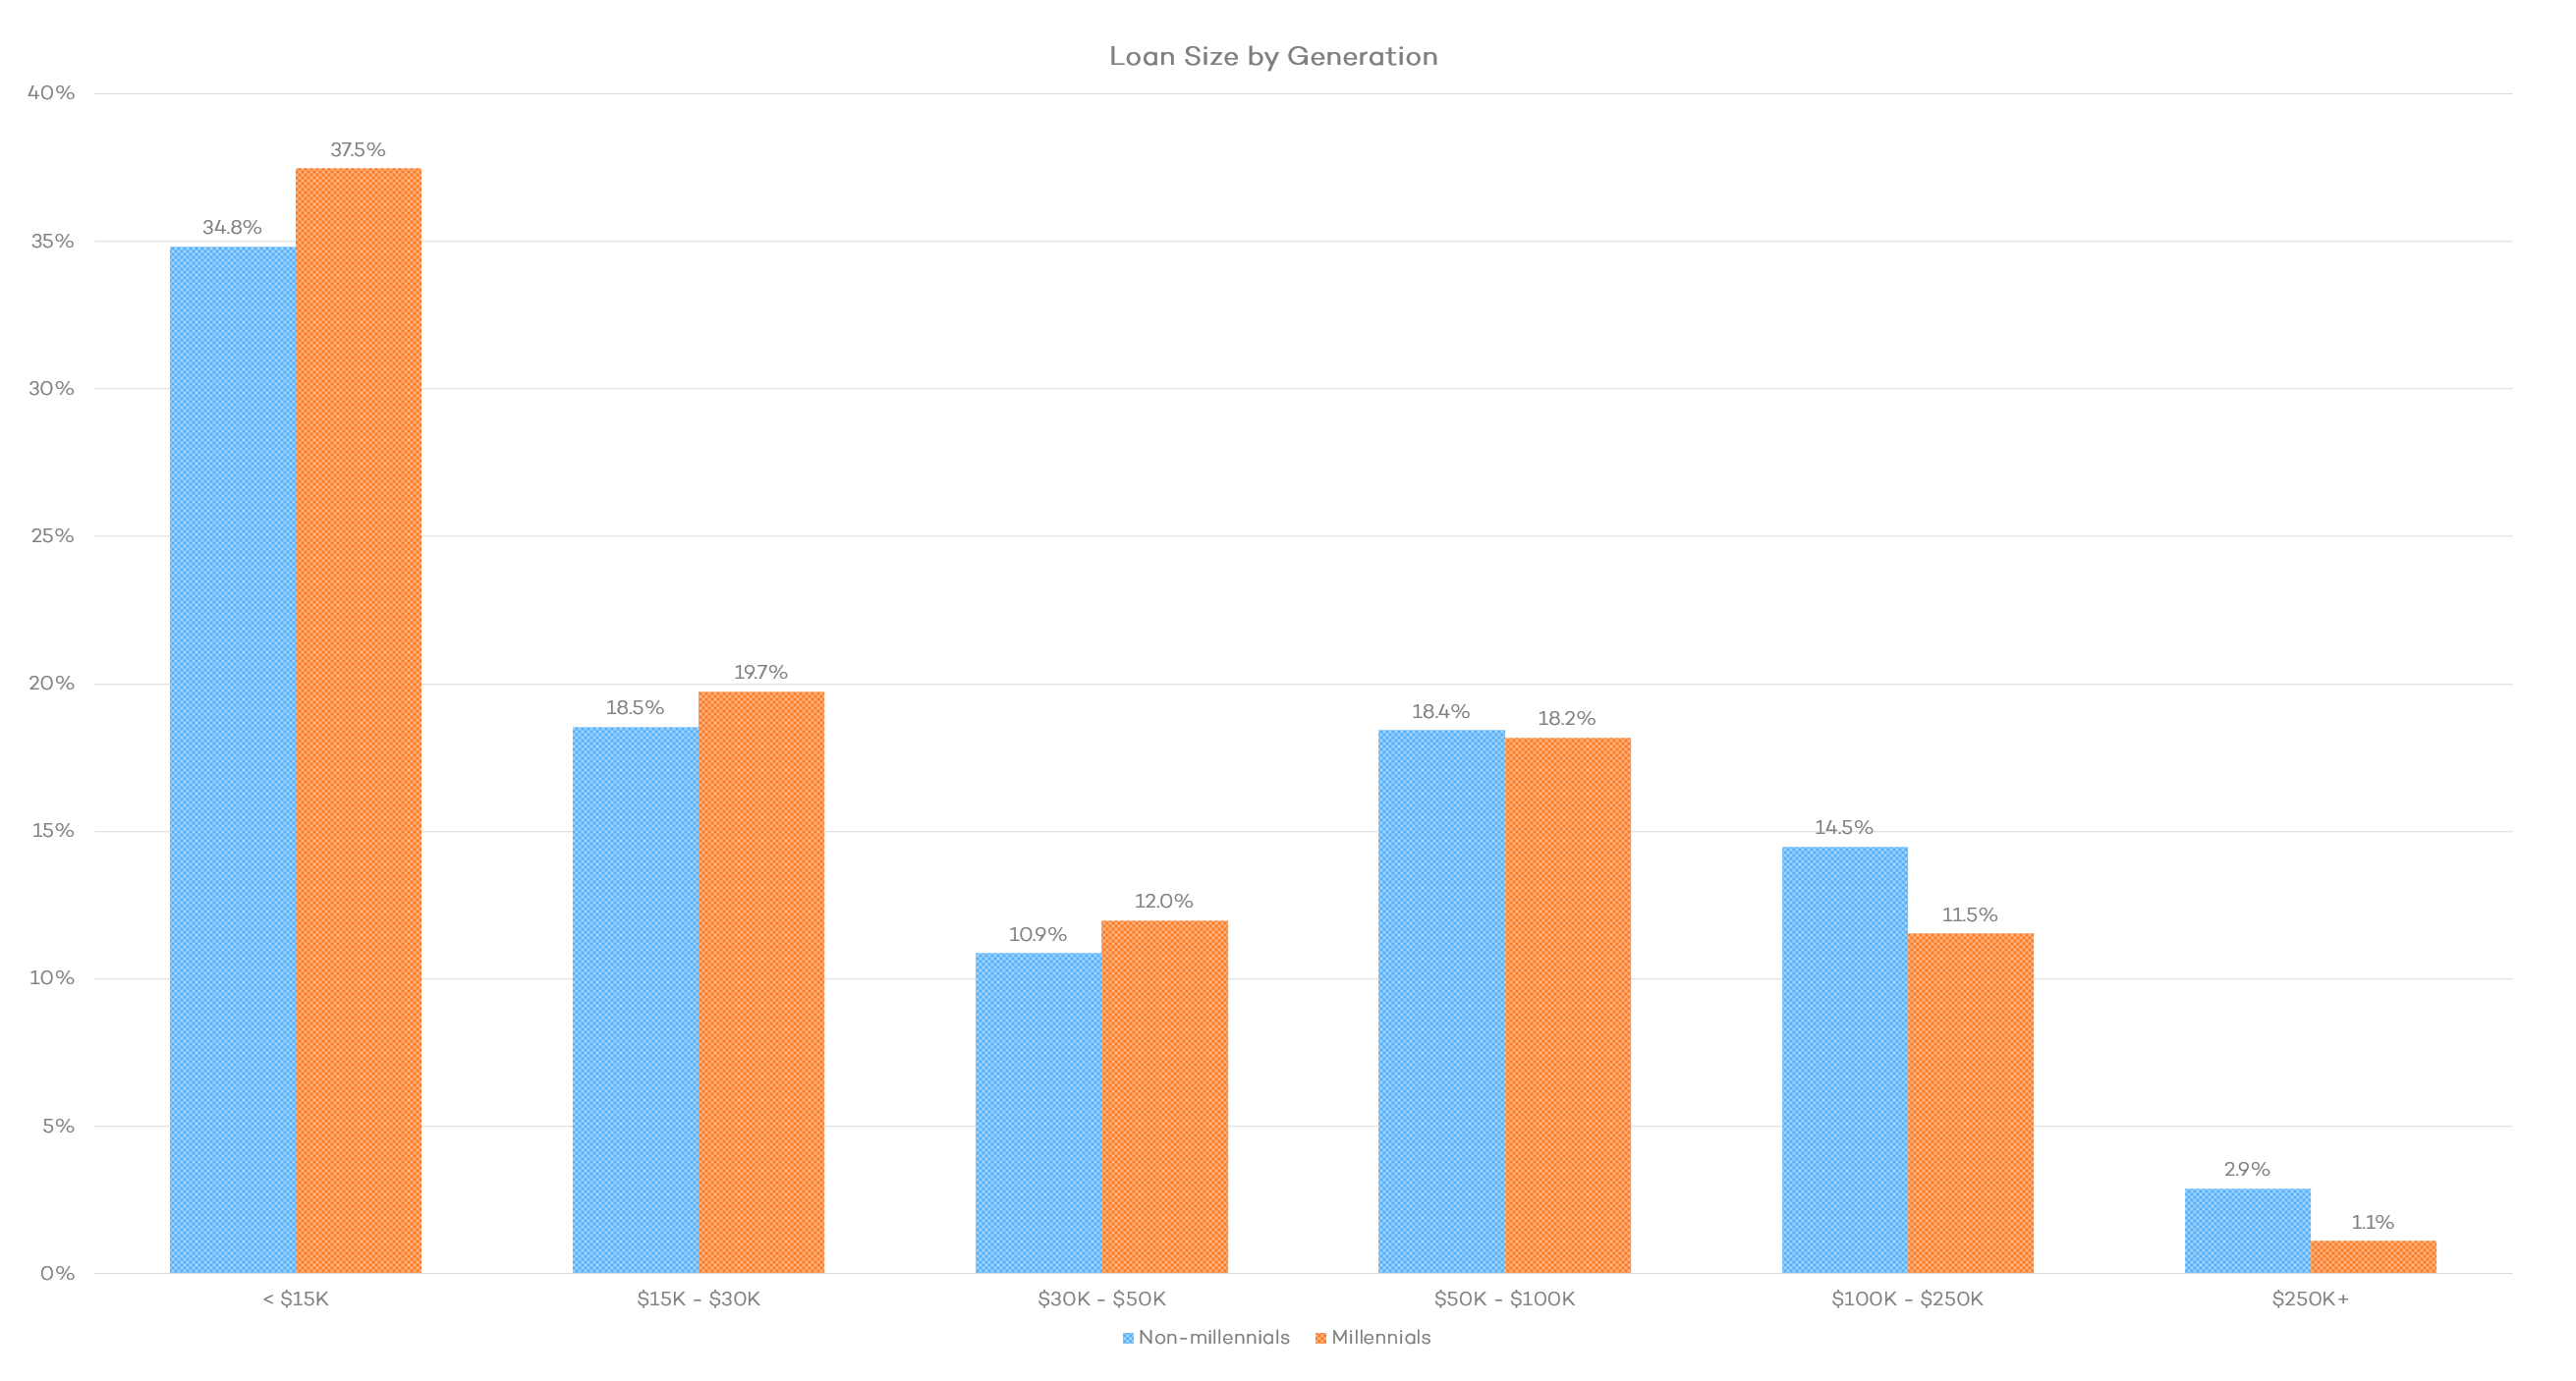
As one might expect, millennials outpace non-millennials in the smaller categories of loans and underperform after the $100K mark.
G. Average Effective APR
As noted by Fundera’s Q3 2015 quarterly report, personal credit score is the primary driver of loan APRs. Interestingly, millennials tend to receive lower-APR offers across the board of loan products, with the exception of short-term loans.

As indicated earlier, a greater portion of millennials than non-millennials have 700+ credit scores, and it is likely that they are who received offers for medium-term loans, medium-term lines of credit, and so on.
Regarding the difference in equipment loan APRs, it might be possible that the equipment financed tends to be of lower value, but this data cannot prove out one way or the other.
4. What Do Millennials Know About Their Fundability?
As a generation, millennials are often criticized as being shallow, entitled, and narcissistic. On the other hand, they receive praise for being community-oriented, civic-minded, and tolerant of others.
It is yet unclear whether any of these claims are true, and if they are, how they could impact the millennial generation’s interactions with the economy. Fundera’s data may help to shed some light on millennial attitudes towards and understandings of their own status as small business borrowers compared to those of non-millennials.
Given the following data, it may seem that millennials are optimistic about future prospects but realistic about the present. Whether or not this is the case, it does appear that millennials understand their credit scores slightly better than non-millennials yet ask for larger loan amounts than they receive.
A. Credit Score Prediction
The following graph illustrates the percentage of millennials and non-millennials who accurately predicted their credit scores. This data is based on a comparison of each customer’s self-reported credit score category, which they enter during Fundera’s preliminary questionnaire, and that same customer’s verified credit score, pulled later on in the application process.
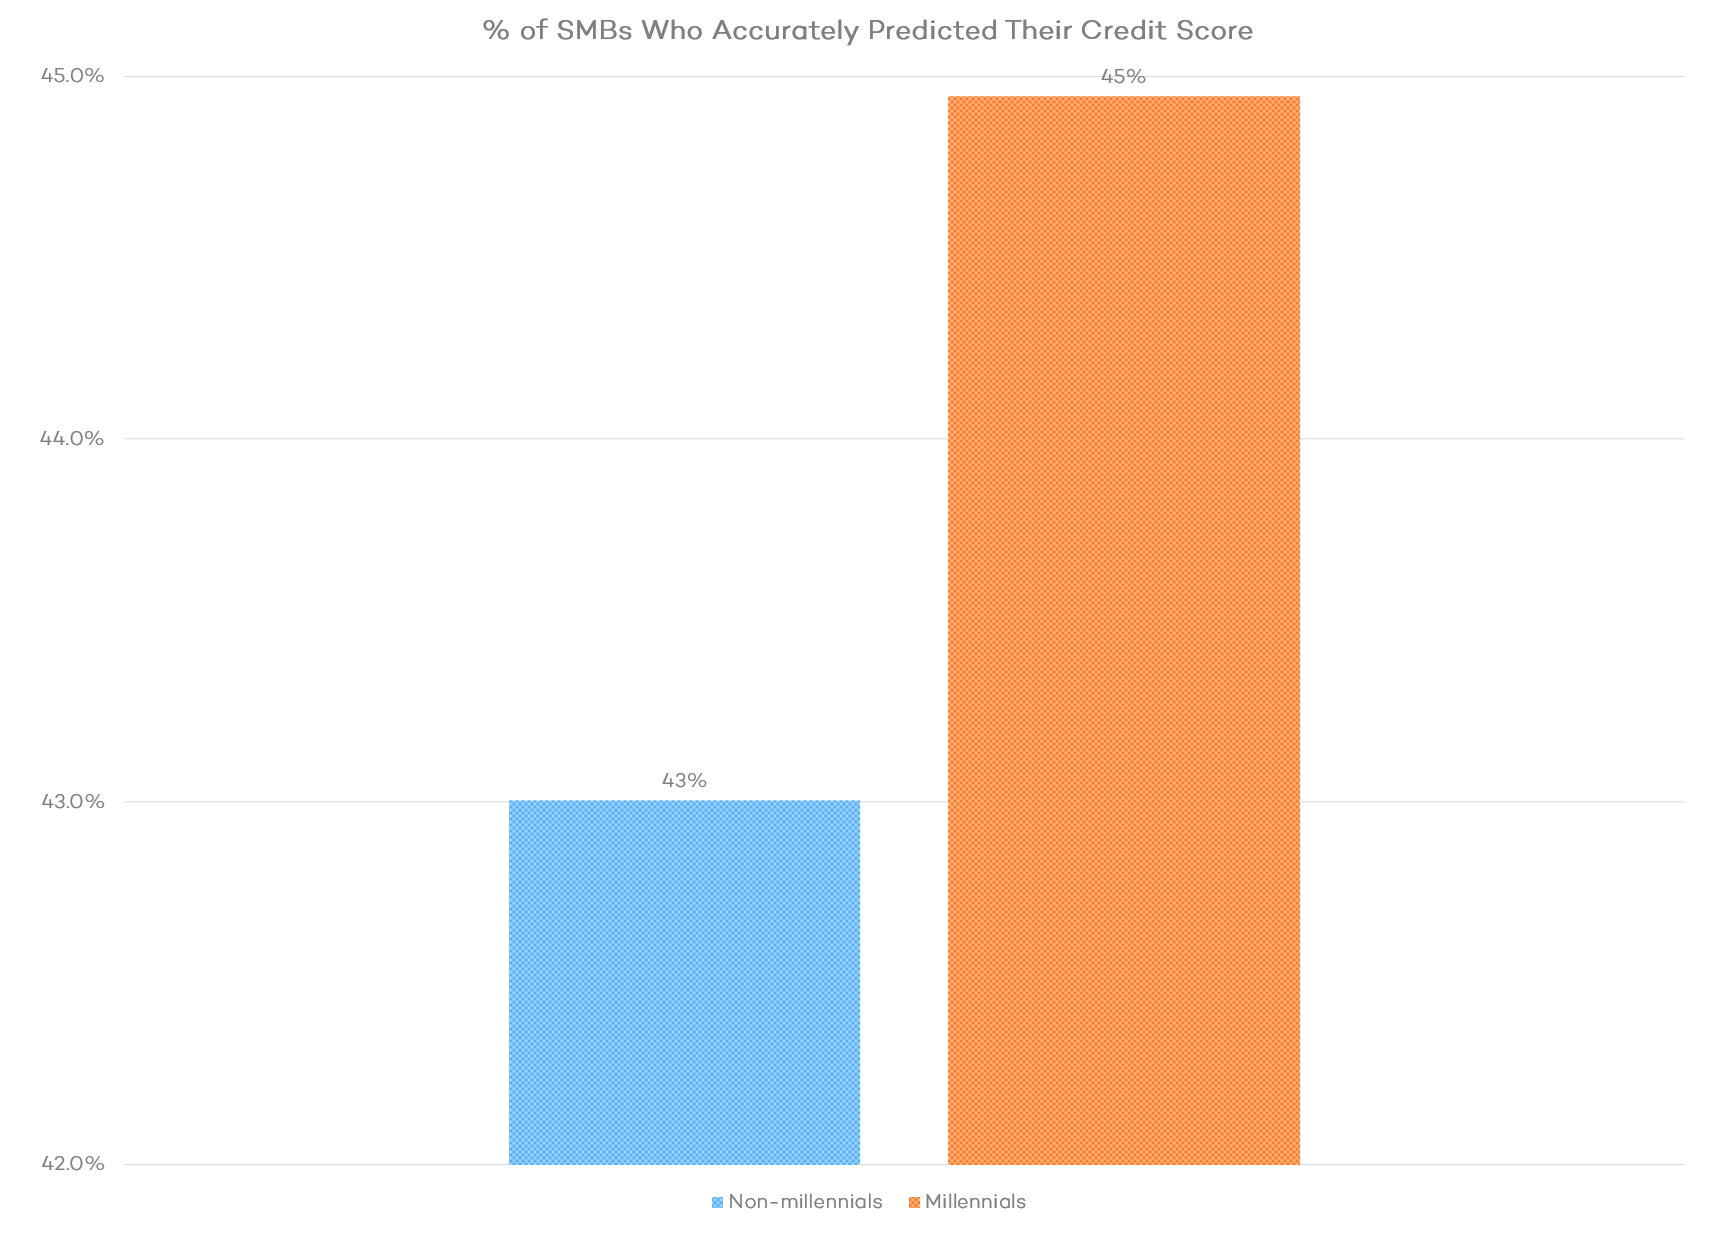
While this may not be a drastic generational divergence, it does seem that millennials more accurately predict their credit scores. This could be due to greater awareness of their borrowing habits, reliance on credit score reporting companies or technology, or something else entirely. As mentioned earlier, there are a number of services that now provide access to credit scores online, including banks, credit card companies, and technology businesses like Credit Karma. It is likely that millennials, as more research-oriented and technology-forward consumers, make greater use of these options.
Notably, this difference holds even in the “Excellent” category (700+), in which a greater proportion of millennials than non-millennials sit. This indicates that millennials with higher credit scores also know their credit scores better.

Although millennials often receive criticism for being lazy or short-sighted, this data appears to imply that they might very well be more attuned to and realistic about their creditworthiness. Online lenders might consider approaching their changing customer base accordingly.
B. Funding Requested and Received
By comparing loan amount requests that funded customers make on Fundera’s questionnaire with their actual loan amounts, it is possible to see whether an expectations gap exists.
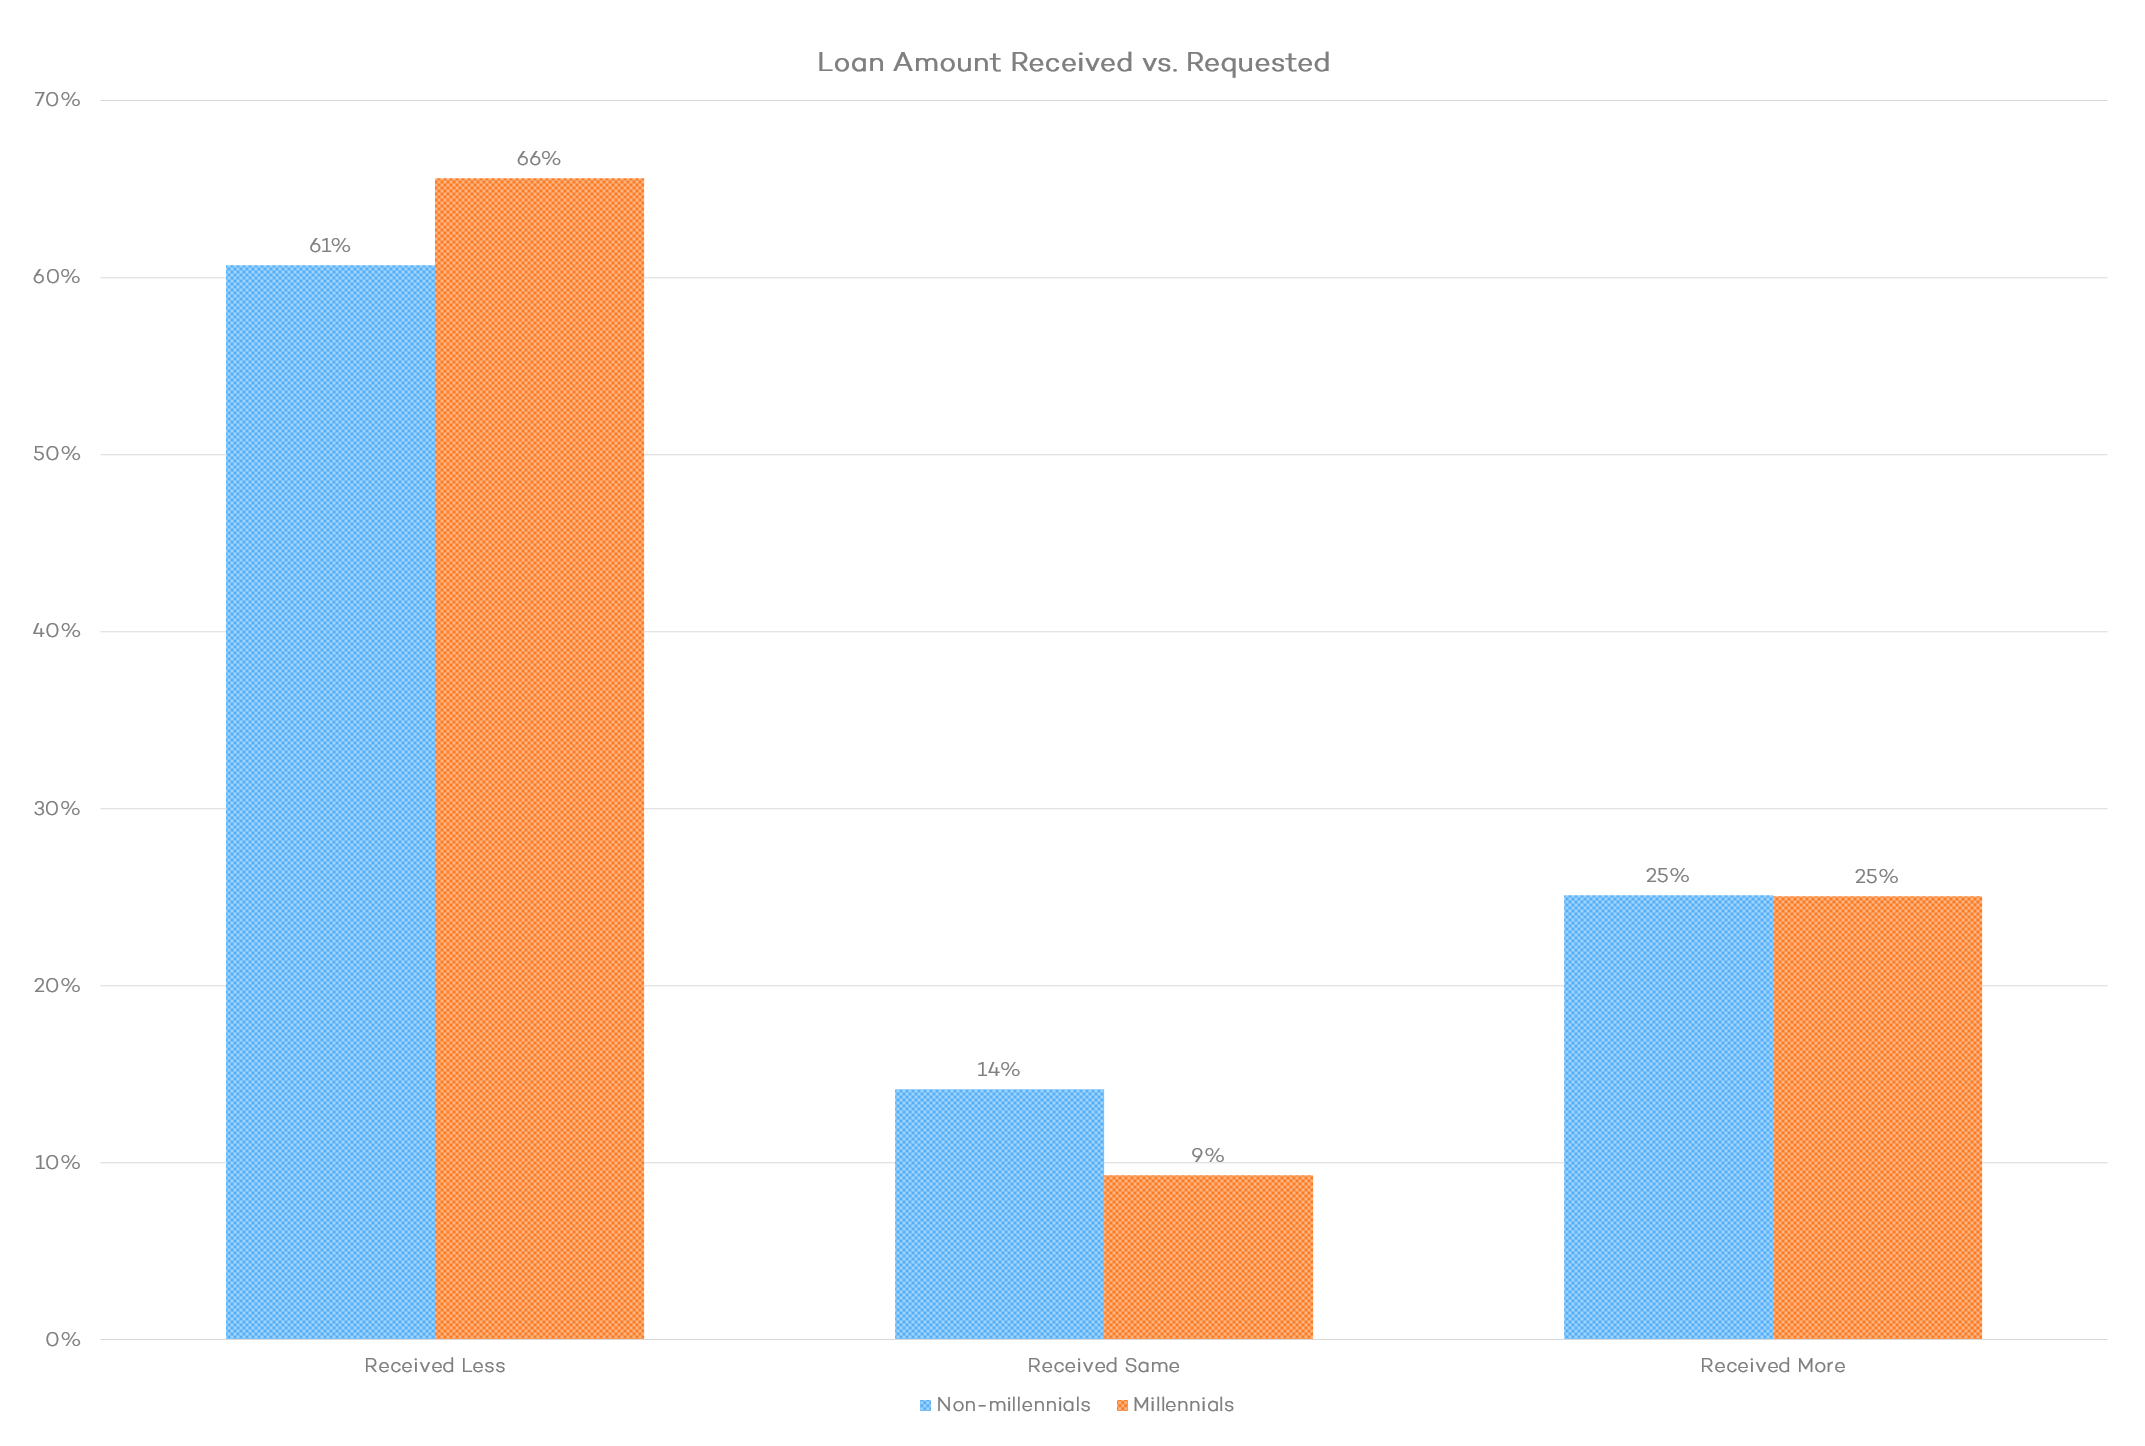
A greater proportion of millennials received lower amounts than they asked for, indicating that they tend to overpredict or overask even more than non-millennials do. This may be due to optimism, misunderstanding, a different attitude towards the questionnaire or question, or something else.
Roughly a quarter of both millennials and non-millennials receive more: the difference between the “Received Less” category is made up in the “Received Same” bucket instead. Whether or not this can be extrapolated into a difference in optimism or understanding the relationship between eligibility criteria and loan size cannot be determined by this data alone.
Looking Ahead
For Fundera’s future quarterly reports, small business owners can expect:
- Investigations into funding trends. Fundera’s position in the industry gives it a unique perspective into developing trends among both borrowers and lenders.
- Credit product analyses. Upcoming quarterly reports will look deeper into specific loan products, much like Fundera’s second report on lines of credit.
- Insights into Fundera and the small business lending industry. Both Fundera and online lending as a whole are constantly evolving. Future reports will continue to comment on these changes.
If you have questions or feedback about The State of Online Small Business Lending, please email transparency@fundera.com.
Access the PDF version of this report here.
The post The State of Online Small Business Lending — Q1 2016 appeared first on Fundera Ledger.
from Fundera Ledger https://www.fundera.com/blog/2016/04/11/the-state-of-online-small-business-lending-q1-2016/
No comments:
Post a Comment