The word “transparency” gets thrown around a lot—but what does it actually mean?
In small business lending, it means access to industry-wide information on eligibility requirements and rate trends. It means clear and concise explanations of all the different loan products available. It means holding lenders and brokers accountable for their actions, and enforcing honesty on every level.
Here at Fundera, we’re no strangers to transparency. Our business model works by creating a buyer’s market, putting the borrowing power back in the hands of small business owners. We’ve built Know Before You Owe, the most comprehensive database of small business terms, guides, and tools. And our Small Business Borrower Bill of Rights has spread throughout the industry.
Finally, we’ve begun releasing The State of Online Small Business Lending, a quarterly report that makes use of our own data and analysis to promote the transparency we’ve been talking about. We’ll be covering topics like eligibility, aspects of your funding, demographics of small business owners, types of lenders and loan products, and more. It’s for small business owners, by small business owners.
You might read this report to better understand the small business lending industry at large, or you might be interested specifically in where your small business matches up with the rest. Either way, we hope that our data will help you see small business lending in a clearer, fairer, and more transparent light.
Takeaways:
- Medium-term lenders are gaining more market share, possibly inspiring top short-term lenders to introduce multi-year loan products
- For the purposes of this and future quarterly reports, Fundera will be dividing its line of credit product into two subcategories: medium-term lines of credit and short-term lines of credit
- This short-term line of credit product serves a riskier borrower class, increasing the product diversity available to borrowers with lower credit scores
Data Findings:
Q4 Product Data
- The amount of dollars funded in the medium-term loan category increased by 15% in Q4
- The amount of dollars funded in the short-term loan category decreased by 9% in Q4
- APR for the overall line of credit product increased in Q4, while average credit score decreased, further confirming Fundera’s findings in Q3 that there is an inverse correlation between APR and credit score
- Time to funding and annual revenue also decreased for the overall line of credit product in Q4
- Despite these changes, the dollar volume proportion of line of credit stayed the same in Q4
Q4 Demographic Data
- Nearly 30% of funded borrowers exhibited credit scores between 620 and 660
- About 35% of borrowers showed between $100K and $300K of annual revenue
- Top 6 states for funded customers include CA, FL, NY, TX, GA, and IL
- Merchandise and Restaurant / Cafe / Bar tied for highest funded industry type (8%)
- Roughly 26% of funded customers were millennials, between 18 and 36 years of age
A Unique Perspective on the Online Small Business Lending Industry
As discussed in its previous quarterly report, Fundera is both uniquely positioned and especially motivated to share its understanding of the small business lending industry. Fundera is dedicated to fostering an atmosphere of honesty, fairness, and transparency for small business owners. With its quarterly report, Fundera aims to supplement the Bill of Rights with data-oriented observations of trends in alternative and small business lending.
This report encompasses all transactions mediated by Fundera between February 2014 and December 2015 (Q4 2015) inclusive, covering just over 1,900 loans. All data has been equalized to APR, which is an imperfect but standard metric, and the idiosyncrasies of different loan products have been accounted for, as much as possible, in the presentation of the data.
There are two qualities to Fundera that give access to an unprecedented scope of data dealing with the state of online small business lending. Though outlined in the initial report, these are worth revisiting, as that data has only evolved in the past months.
1. Extensive array of lenders
In the interest of serving small business owners, Fundera works only with the industry’s most honest and responsible lenders. As the alternative lending landscape continues to swell, however, Fundera has added more lenders to its platform, found in the table below. Information and reviews about these lenders can be found on Fundera’s lender review site.

2. Diverse scope of small business owners
Because Fundera partners with multiple lenders, it is able to provide different loan products and product grades to small business owners of nearly every risk level. This demographic data does not reflect the online alternative lending industry as a whole, but it does offer a particularly wide-ranging perspective on who is looking to fund their small business through online and alternative sources.
In the interest of encouraging transparency and continuity between quarterly reports, a number of graphs and charts detailing these demographic trends can be found below.
A. Credit Score and Annual Revenue Distributions
These two charts reflect the breakdown of Fundera’s funded customers’ credit scores and annual revenues. Few small business owners receive funding through the platform with subpar credit scores and low revenues, while a large portion of funded customers sits in the middle to upper tiers of credit score and in the middle categories of annual revenue.
With more loans going to borrowers in the 620 to 660 credit score and $100K to $300K annual revenue ranges, it is clear that the alternative lending industry continues to serve borrowers who would most likely be unable to secure funds at a traditional bank.

B. Top 10 Industries Served by Fundera
This chart details the 10 industries funded most through the Fundera platform. There are 65 industry categories overall, with over half accounting for less than 1% each—a testament to the diversity of small businesses that require alternative funding.

C. Top 6 States with Funded Customers
These six states account for 45% of all small business owners funded through Fundera. The state with the lowest amount is Vermont, with only 0.05% of total funded customers.
Unsurprisingly, the top 8 most populous states in the U.S. are California, Texas, Florida, New York, Illinois, Pennsylvania, Ohio, and Georgia.

D. Age Ranges of Funded Customers
As might be expected, over nearly 85% of Fundera’s small business owners successful in securing a loan fall between the ages of 25 and 59. More surprisingly, 26% of funded customers fall between the ages of 18 and 36—the millennial generation. (Interestingly, 15% of funded customers belong to the ages of 36 to 39.)

Medium-Term Lenders Grab More Market Share
The following chart shows Fundera’s dollar volume by product type for Q3 and before. Notably, medium-term loans accounted for 32% of funded dollar amount, while short-term loans accounted for 34% of funded dollar amount.

However, according to the same data for Q4 2015 below, short-term loans represented only 24% of dollar volume while medium-term loans rose to represent 47%.
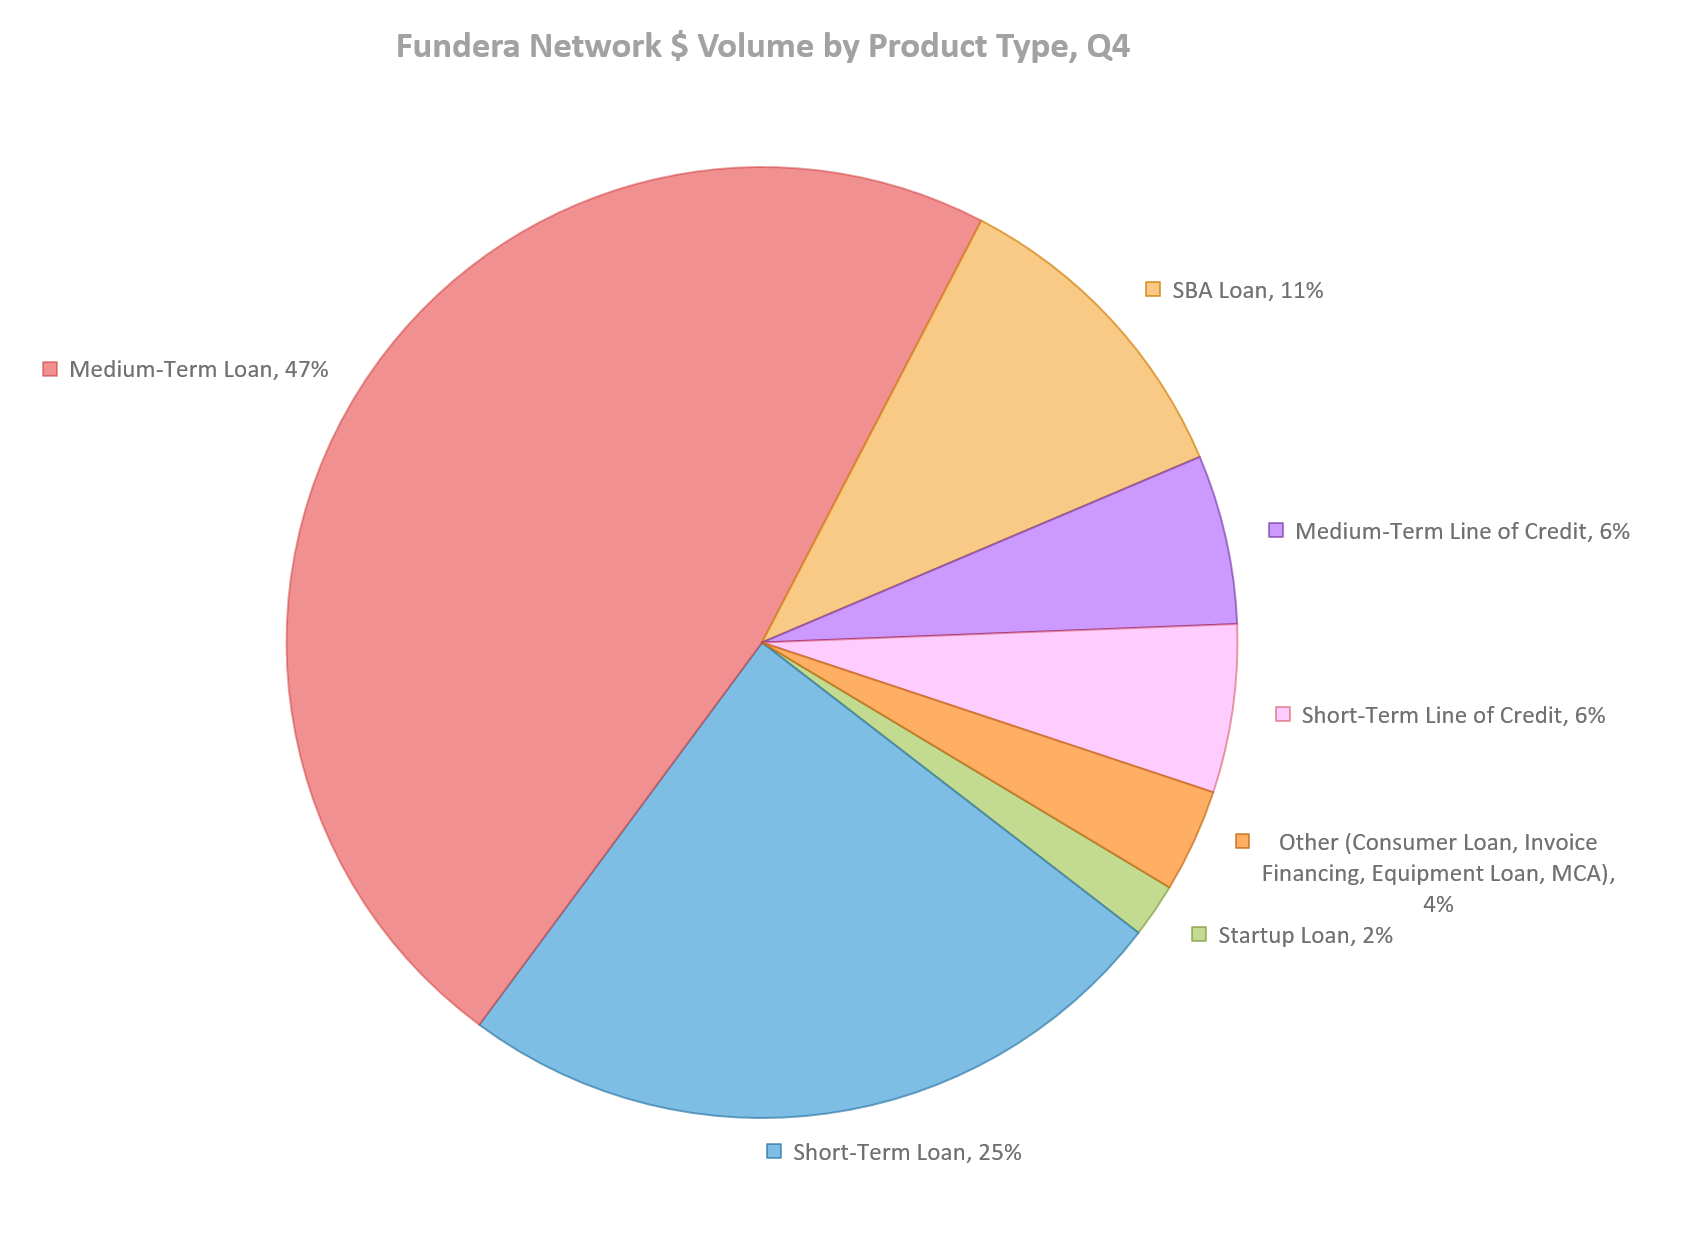
In Q4 2015 alone, the dollar volume for medium-term loans increased by 15% while the dollar volume for short-term loans decreased by 9%.
These numbers not-so-subtly hint that medium-term loans are on the rise, and are quite possibly the fastest growing product on the market.
More interestingly, this spike has been identified around the same time that two of the industry’s largest short-term loan lenders—OnDeck and CAN Capital—introduced lower-rate, multi-year products. It is likely that these short-term lenders noticed similar growth in the medium-term loan product, motivating them to widen their offerings before medium-term lenders take up more of their market share.
There is also the possibility that OnDeck and CAN Capital’s monthly term loans will escalate the growth of the medium-term loan product further as they graduate their existing customers into longer duration products. This bodes well for small business borrowers, as medium-term loans are a more affordable product overall.
The Importance of Reclassifying the Line of Credit Product
Although the eligibility requirements and terms for most of Fundera’s loan products remained consistent between Q4 and previous quarters, they did not for one offering: the line of credit. Instead, the average APR of line of credit loans increased significantly, while decreases were seen across the median time to funding, average borrower credit score, and average annual revenue.
The reason behind these shifts is simple: the line of credit product became available to lower-credit borrowers through Fundera’s platform. While Fundera’s roster of line of credit lenders did not change between the previous quarterly report and this one, the number of loans funded by those lenders did. In particular, the lenders offering especially short-term line of credit options—with lower loan amounts, shorter terms, higher APRs, more lenient credit and revenue requirements, and quicker times to funding—had been added to the Fundera platform near the end of Q3. These short-term line of credit lenders include Kabbage and OnDeck, as opposed to the more traditional medium-term line of credit lenders like Dealstruck, Lending Club, and Credit Junction.
Short-Term Lines of Credit vs. Medium-Term Lines of Credit
As a result, a split between medium-term line of credit and short-term line of credit products emerged, skewing the data that compiled them together. Once corrected, however, the data supported two different ways to categorize lines of credit: as short-term or medium-term.
The following chart, from Fundera’s Business Loans page, displays a continually updated comparison of the median APRs and times to funding of the loan products offered by the platform’s lenders:

Notably, the previous iteration of this graphic did not place the line of credit product evenly between medium-term line of credit (here just “line of credit”) and short-term line of credit.
This is most likely due to the relationship between volume funded and loans funded. In terms of volume of dollars funded, short-term lines of credit account for only 1:4 the volume of medium-term lines of credit. In terms of loans funded, however, short-term lines of credit roughly double the number of loans funded by medium-term lines of credit.
As you can see:
- Dollar Volume by Product Type
- Overall line of credit: 11% of Fundera volume
- Medium-term line of credit: 9% of Fundera volume
- Short-term line of credit: 2% of Fundera volume
- Loans by Product Type
- Overall line of credit: 13% of Fundera volume
- Medium-term line of credit: 4% of Fundera loans
- Short-term line of credit: 9% of Fundera loans
In other words, short-term lines of credit constitute twice as many loans but only a fourth of the dollar volume on the Fundera platform as medium-term lines of credit.

For reference, the interquartile range comprises the data between the 25th and 75th percentiles: it makes up the sensible middle 50% of the data, removing extreme end cases and highlighting the average.
Equally pronounced are the differences in interquartile ranges for eligibility between medium-term lines of credit and short-term lines of credit. It is clear that the short-term line of credit product covers a range of small business owners with lower credit scores and lower annual revenues, at the cost of substantially higher APRs.
By separating out short-term lines of credit, the medium-term line of credit product normalized to an even more exclusive option than it was in last quarter’s report. It may be that this chart in last quarter’s report was influenced by the overlap, or possibly that the significantly shorter time to funding for short-term lines of credit swayed the potentially dual-eligible business owners into the more expensive product.

Finally, this graph looks at the average credit scores of small business owners with lines of credit, before and after dividing the line of credit product into short-term and medium-term options. This split between target customer bases for short-term and medium-term lines of credit is immediately clear: the medium-term line of credit serves small business owners with high credit scores, while the short-term line of credit targets riskier borrowers.
This lets many more small business owners with credit scores between 580 and 639 consider the line of credit structure for their loan products, as opposed to just standard short-term loans or merchant cash advances. Increasing the diversity of product offerings will let borrowers choose the right products for their businesses based on multiple factors, not just cost of capital alone.
Online Small Business Lending: Looking Ahead
For Fundera’s future quarterly reports, small business owners can expect:
- Historical analysis of funding trends. Fundera’s first two reports dealt with trends in eligibility requirements, average annual revenues and credit scores, loan APRs and volumes, and more. Future reports will continue to keep tabs on these factors.
- Close-up investigations of credit products. Like this one, upcoming quarterly reports will look closely at the numerous variables involved in small business funding, from lender eligibility standards to demographics.
- Observations on Fundera and small business lending. This report will provide insight into both Fundera’s evolution as a small business funding marketplace and the small business credit industry at large. Over time, both will change, and future reports should capture these shifts.
If you have questions or feedback about The State of Online Small Business Lending, please email transparency@fundera.com.
Access the PDF version of this report here.
The post The State of Online Small Business Lending — Q4 2015 appeared first on Fundera Ledger.
from Fundera Ledger https://www.fundera.com/blog/2016/02/02/the-state-of-online-small-business-lending-q4-2015/
No comments:
Post a Comment